Overall Charts
Overall charts use all the available sessions to show progress over time and calculate overall metrics for your entire session history. These charts are available via buttons on the mini toolbar or when viewing session charts.
FTP Estimates
Important
NEW in 2.0 shows critical power trend over time
NEW in 2.1 include color for each FTP proxy in the hover tool
NEW in 2.4 show Critical Power estimates from sessions with Empty Tank Efforts
NEW in 2.6 added tabs for cycling and running FTP Estimates
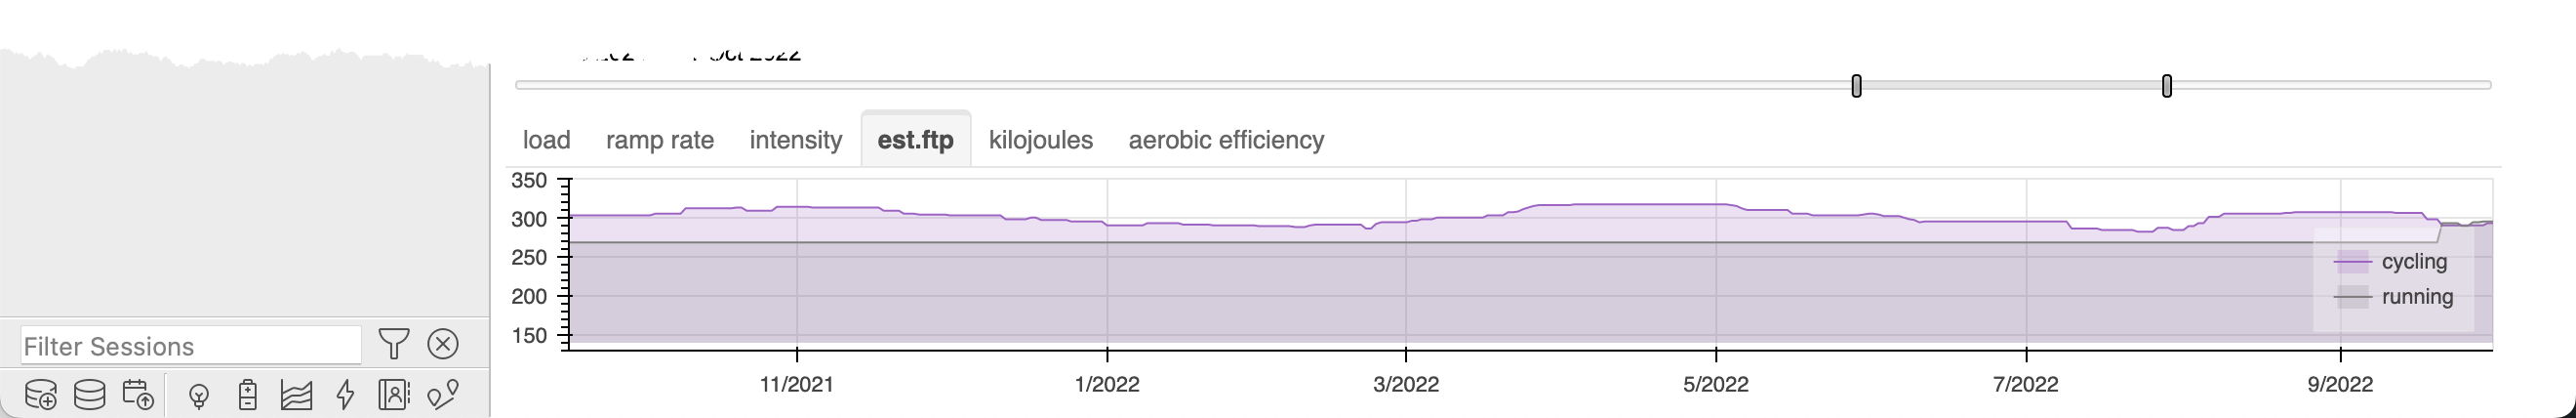
Cycling
FTP Estimates for 5-, 8-, 20-, 30-min, 1-hour and max effort are calculated for each day in your history. Each estimate can be turned on or off and you may zoom to whatever time period you want within your session history.
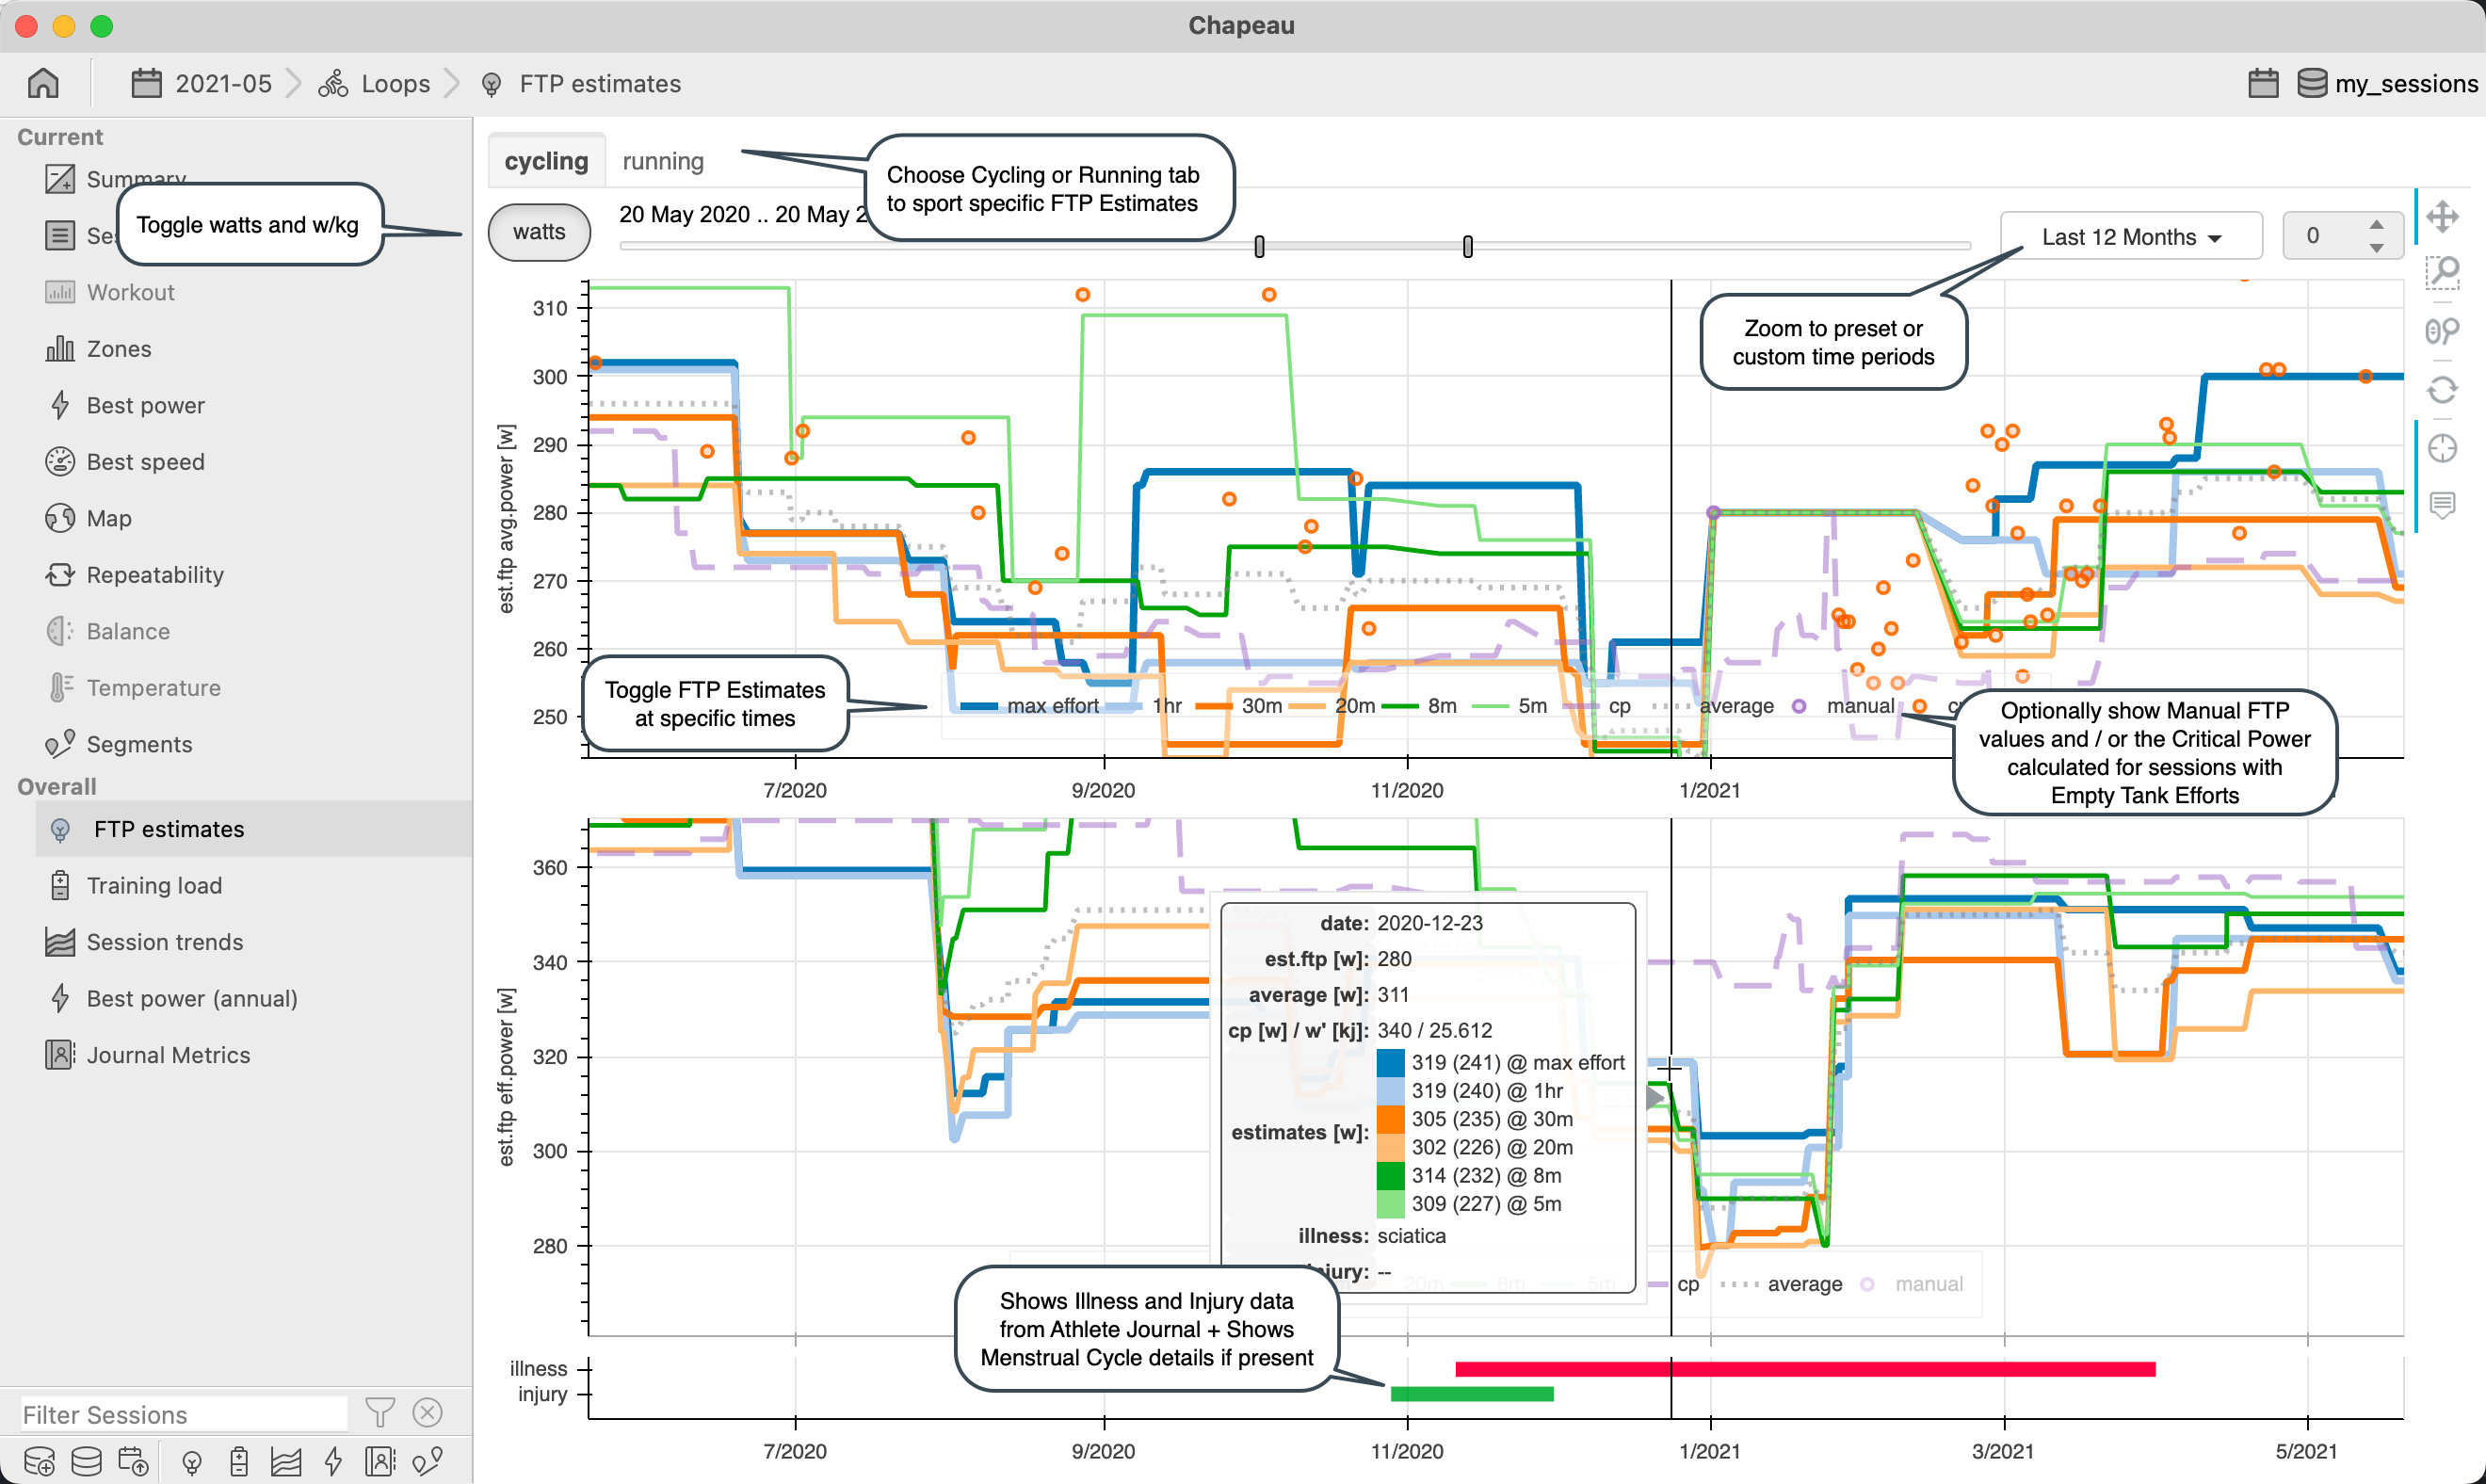
The chart is split into estimates for FTP using average power and using effective power.
Note
When weight is included in Athlete Journal then the toggle option for watts or w/kg will be shown.
Each chart shows:
each of the times (e.g. 5m, 8m, 20m, …) are time based proxies for approximating FTP
each proxy has a scale factor applied to the power output for that time period
each time proxy line (e.g. 5min, 8min…) represents the best estimate of FTP for that proxy in a six week moving window
the average line on the chart is the average of the time proxies
manual ftp entries (if any are above the estimated ftp value)
modeled critical power for each session
critical power calculated from empty tank efforts (on average power only)
The hover tooltip shows the details for each day:
date – date at mouse location
est.ftp – combined value based on the average from avg.power and the average from eff.power
average – this is the average of the FTP estimate from each time proxy for a specific power type (avg or eff)
cp / w’ – critical power and anaerobic work capacity
estimates:
color swatch corresponding the the line in the chart
value of the time proxy line for the current date (based on best effort in past 6 weeks)
in parentheses the value represents the FTP Estimates for the session on that day
time proxy label (e.g. 5m, 8m)
Note
The est.ftp value in the hover is based on average and effective power and corresponds to what is shown on the session summary.
Running
FTP Estimates for 10-, 20-, 30-min, 1-hour and max effort are calculated for each day in your history. In addition a time trial (20 min effort after ~10 min warmup) and a 9-min/3-min proxy are calculated. Each estimate can be turned on or off and you can zoom to any time period in your session history.
Training Load
Important
NEW in 2.1.1 renamed Stress to Load
NEW in 2.3 include Aerobic Efficiency
NEW in 2.4.2 include Fitness Ramp Rate
NEW in 2.6 added support for running sessions
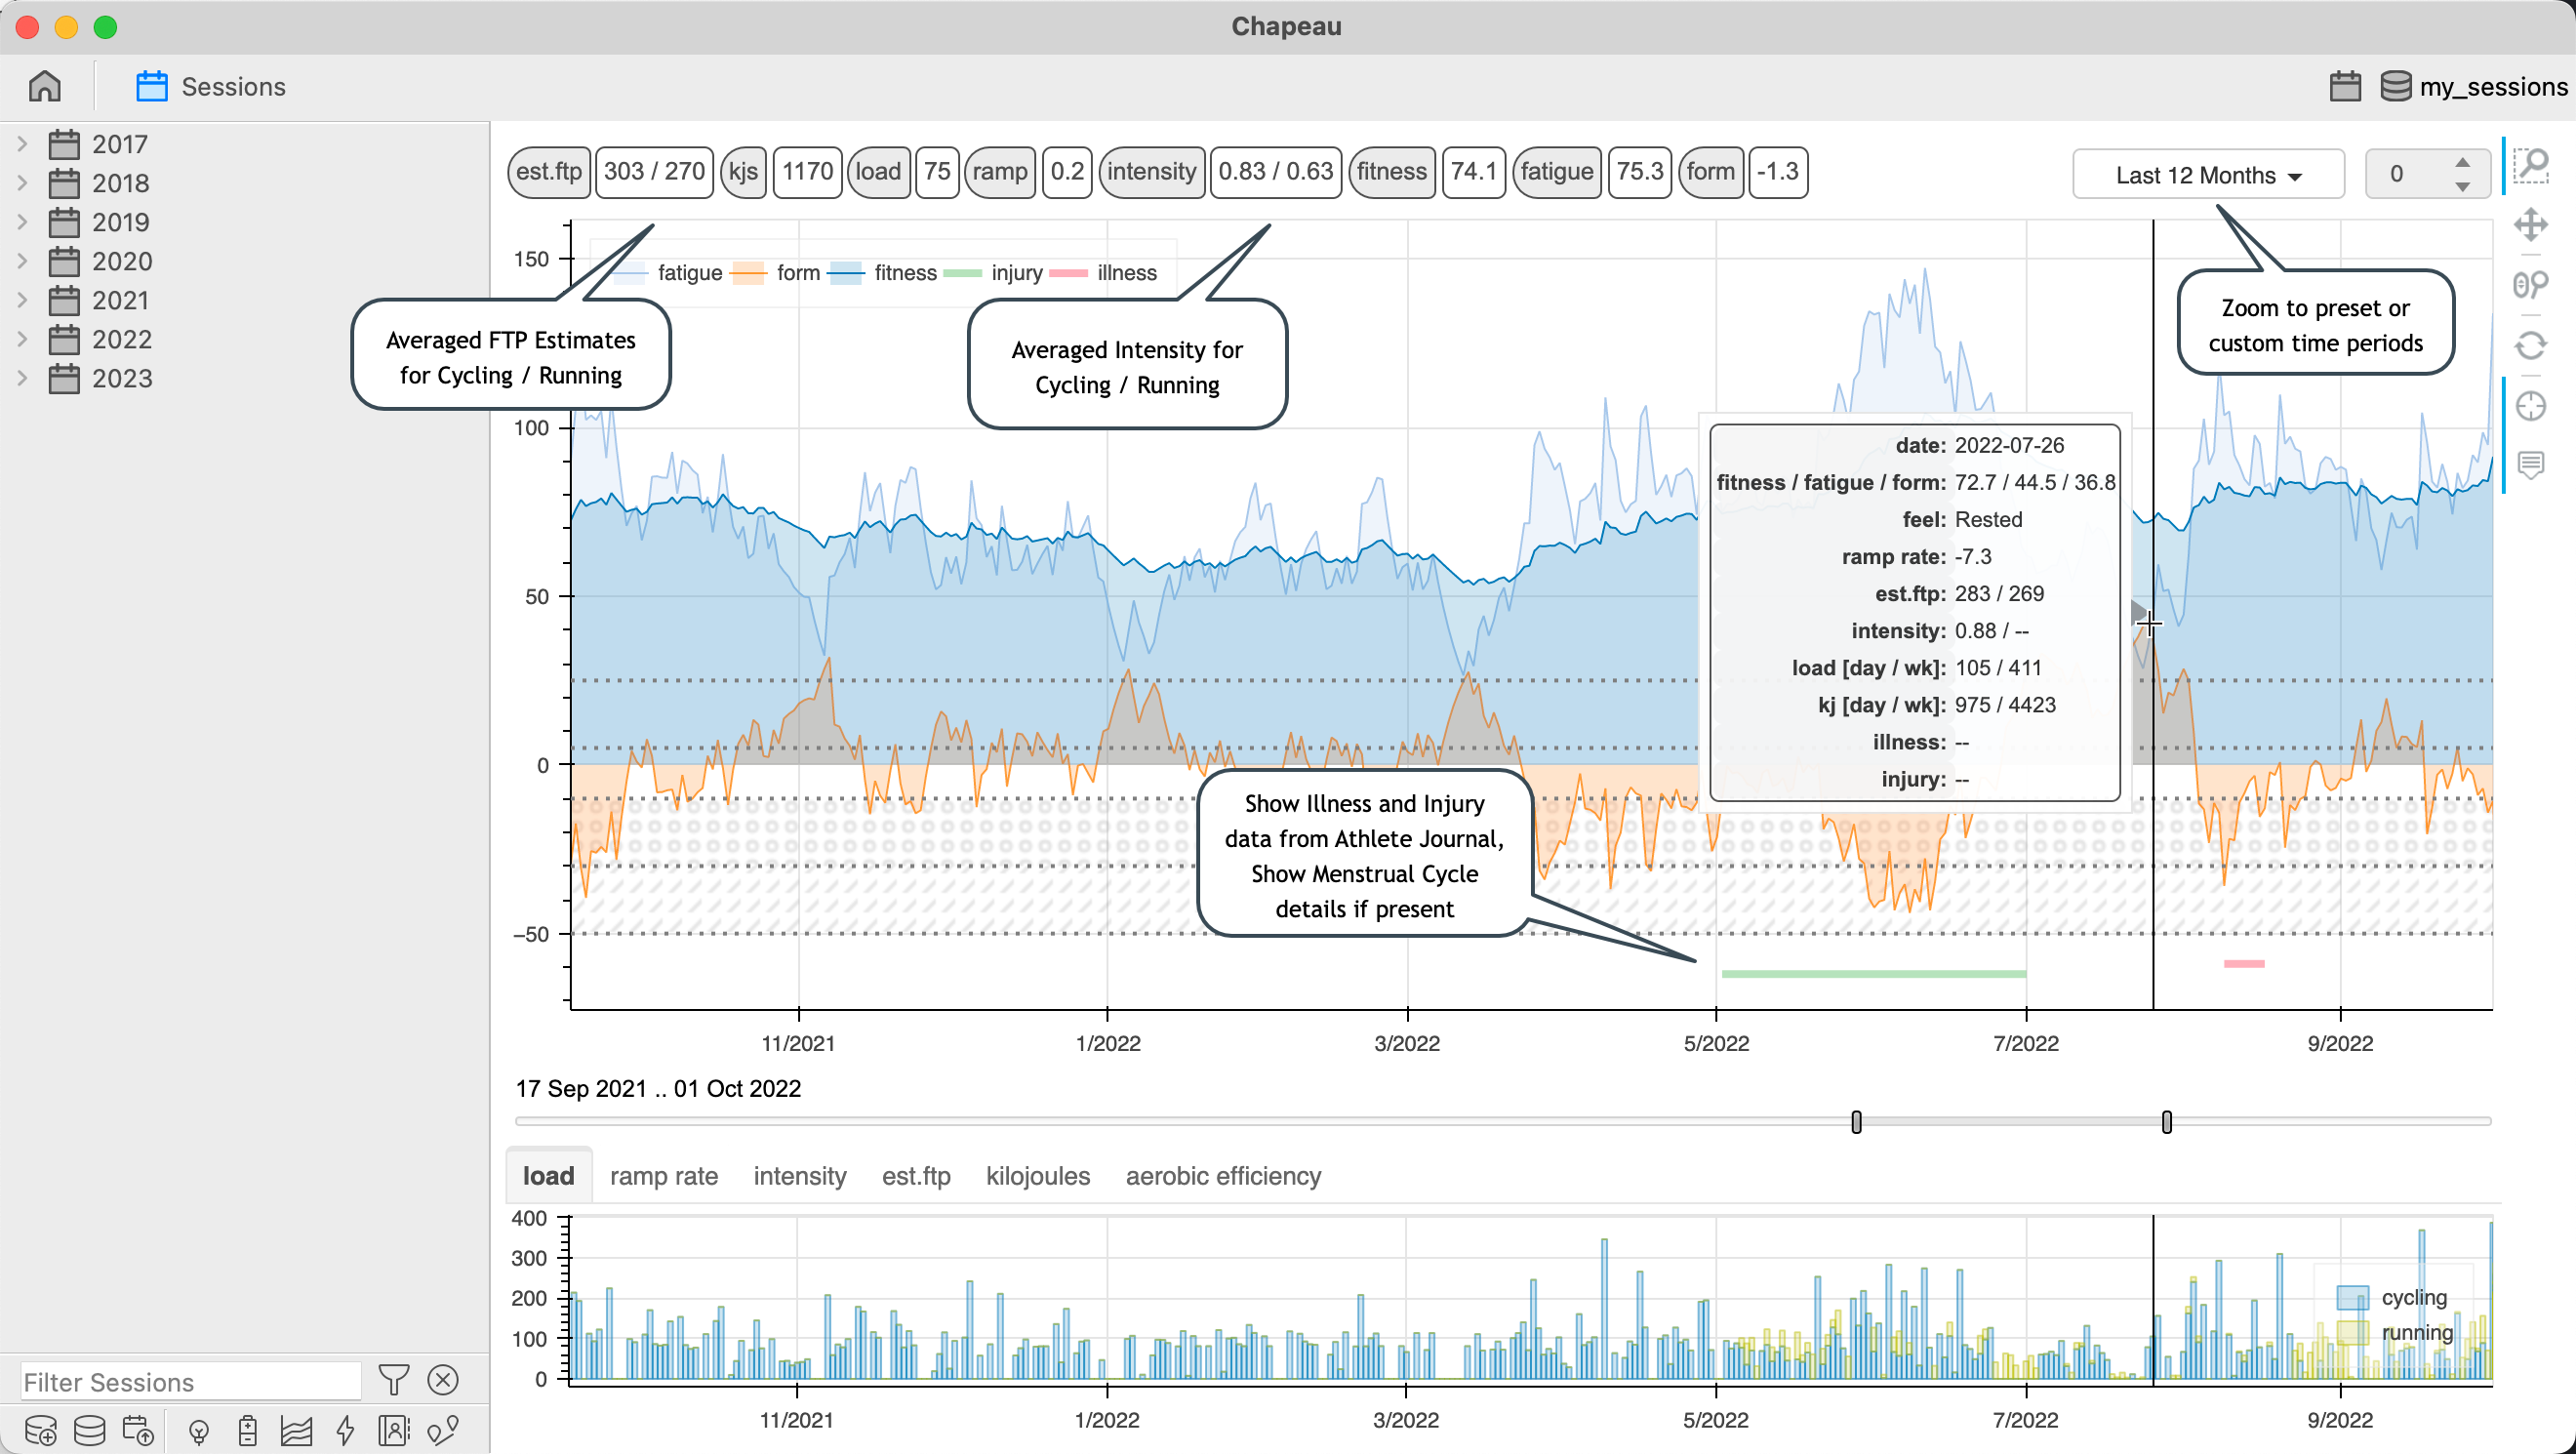
The Training Load chart displays athlete Fitness, Fatigue and Form for the entire available session history. Extra details such as load and kilojoules can be shown on the sub chart at the bottom.
Note
Training load for running sessions without power will be estimated when weight is present in Journal Metrics.
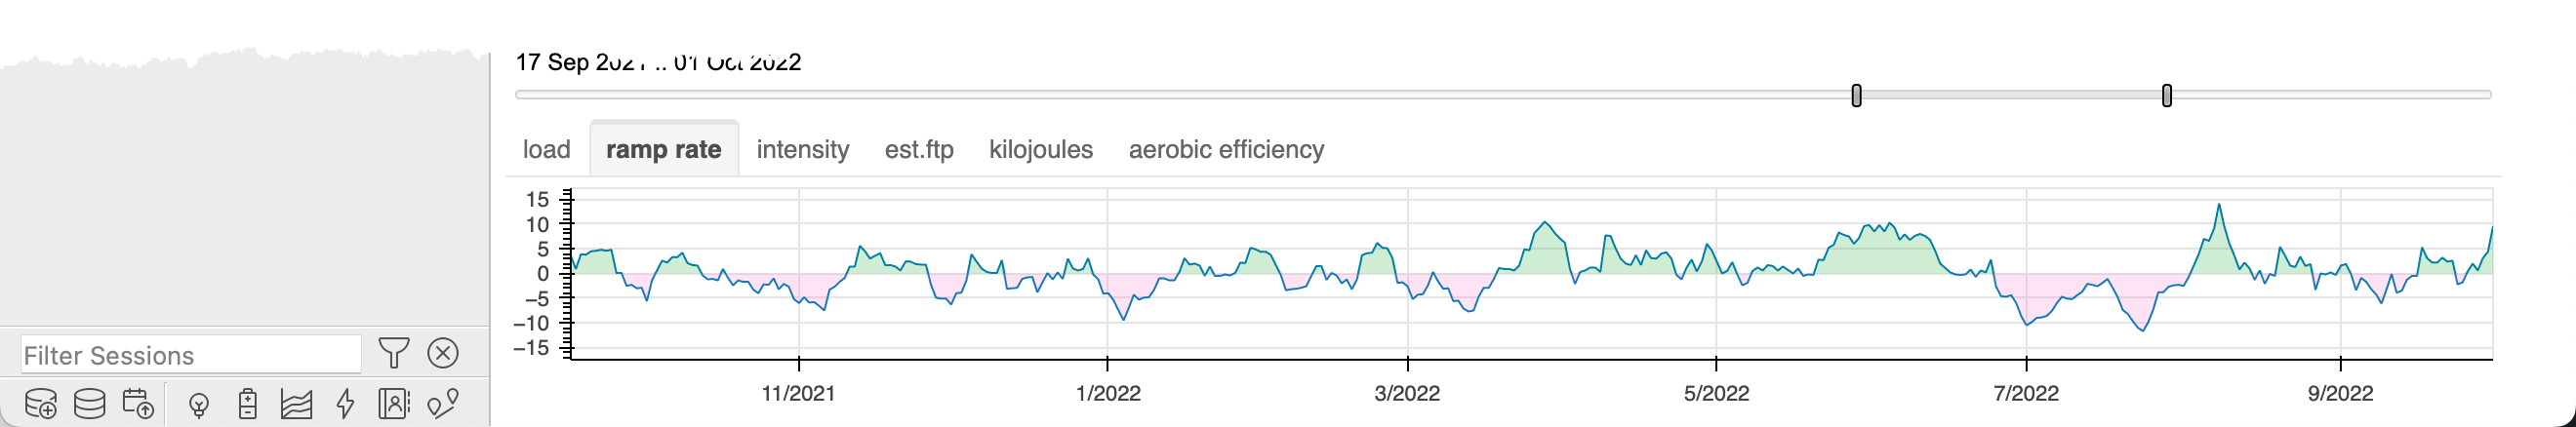
Ramp Rate
Ramp rate for training load.
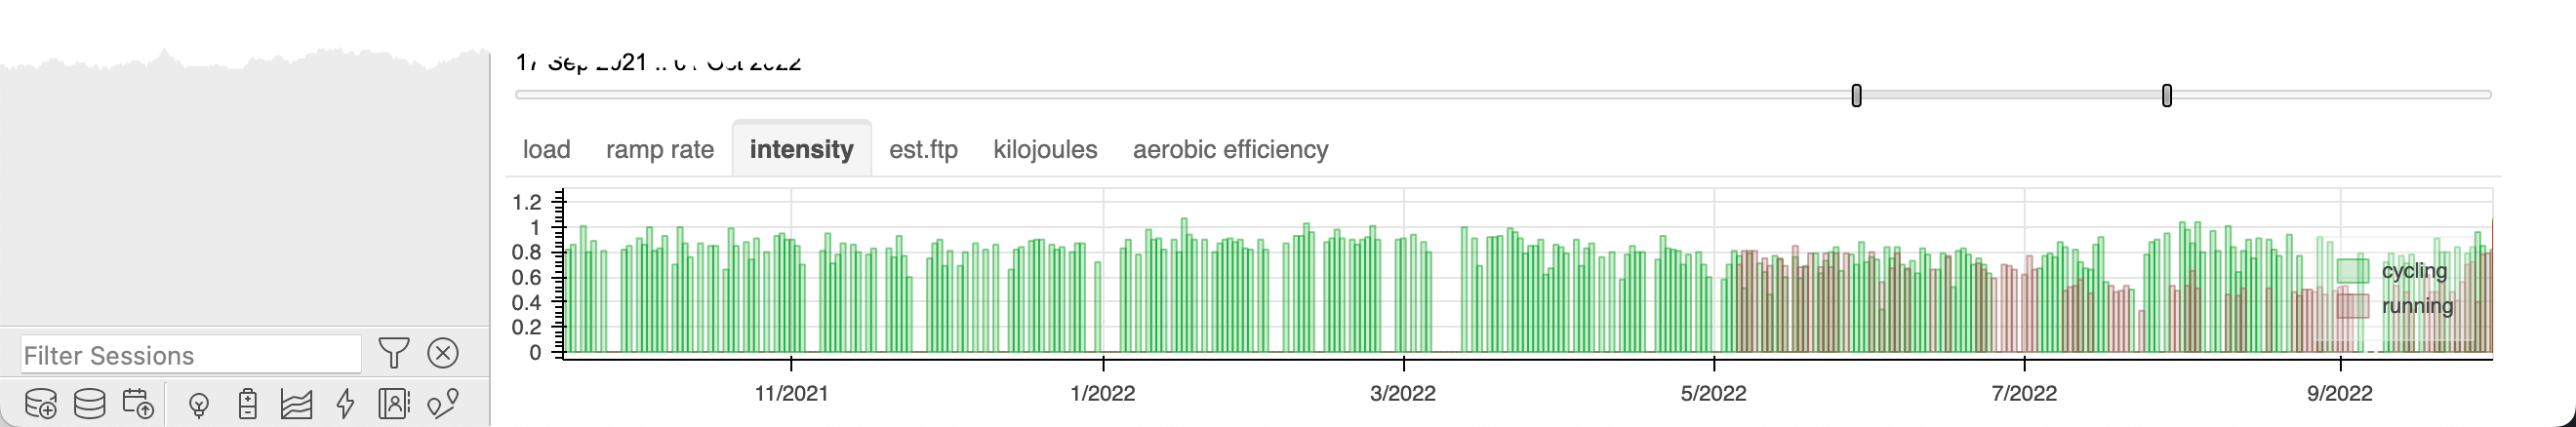
Intensity
Intensity by sport, aggregated per day.
Estimated FTP
Estimate FTP per sport.
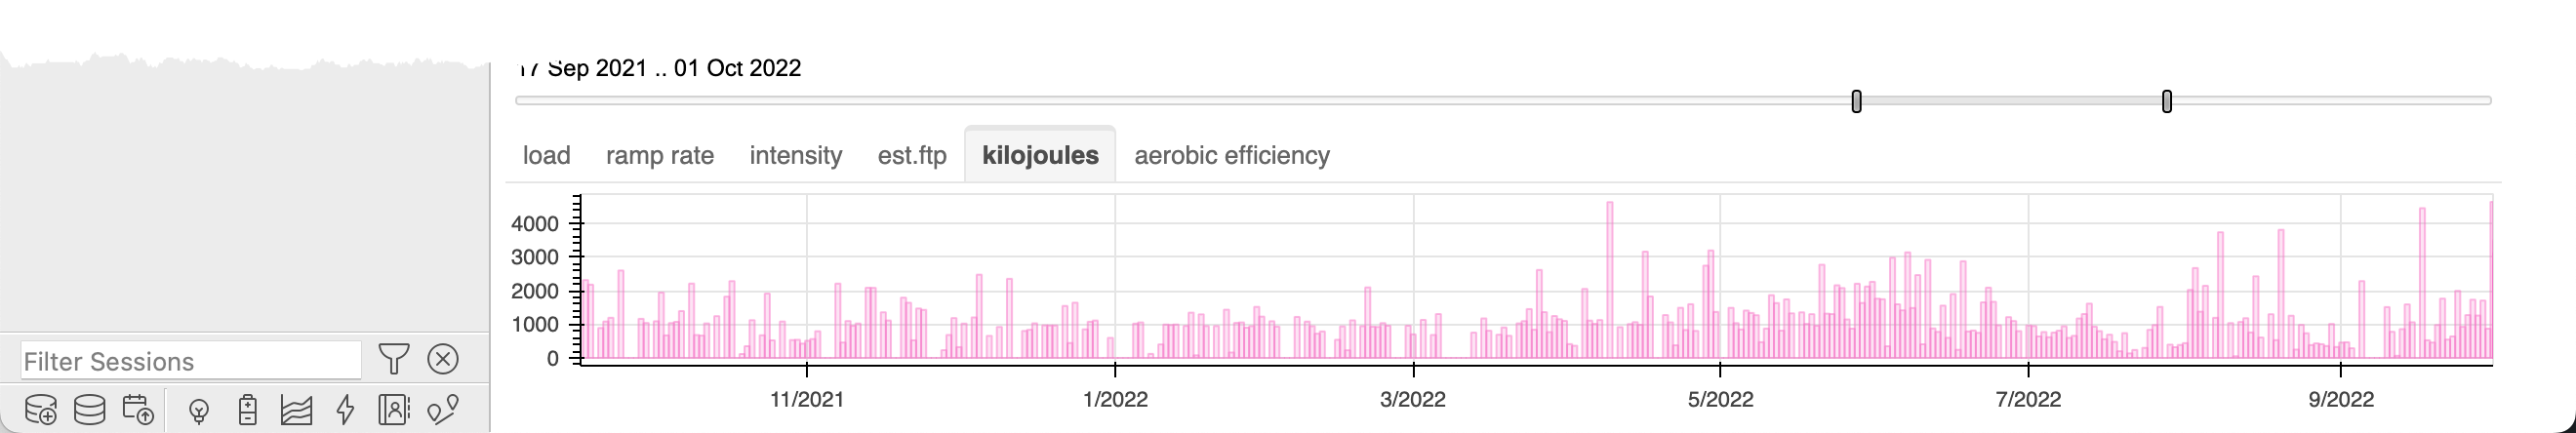
Kilojoules
Kilojoules per day.
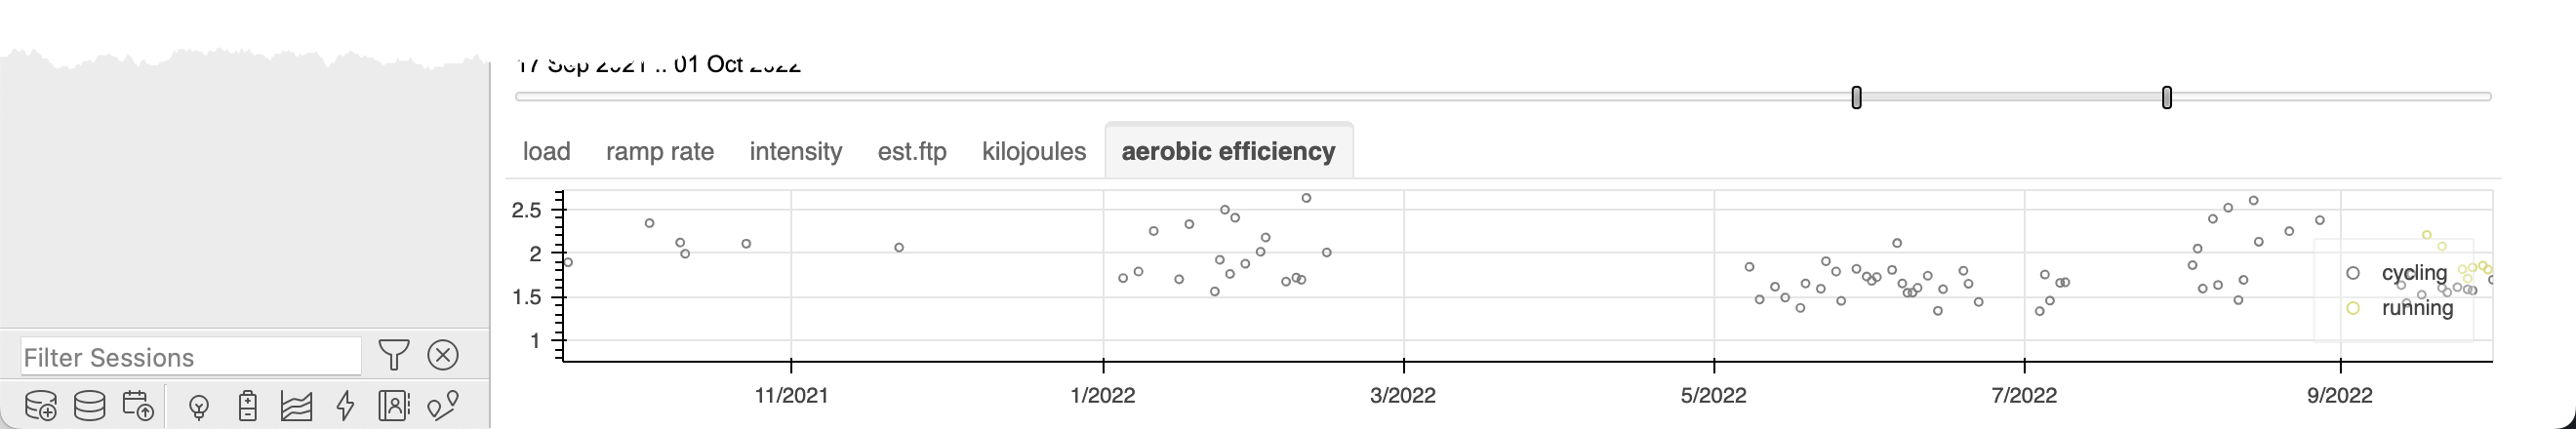
Aerobic Efficiency
Aerobic Efficiency per sport, aggregated per day.
Session Trends
Important
NEW in 2.4.2 renamed Ride trends to Session trends
NEW in 2.6 added support for running sessions
The session trends chart shows summary metrics for each individual session across the entire session history to help give a feeling for trends in the data.
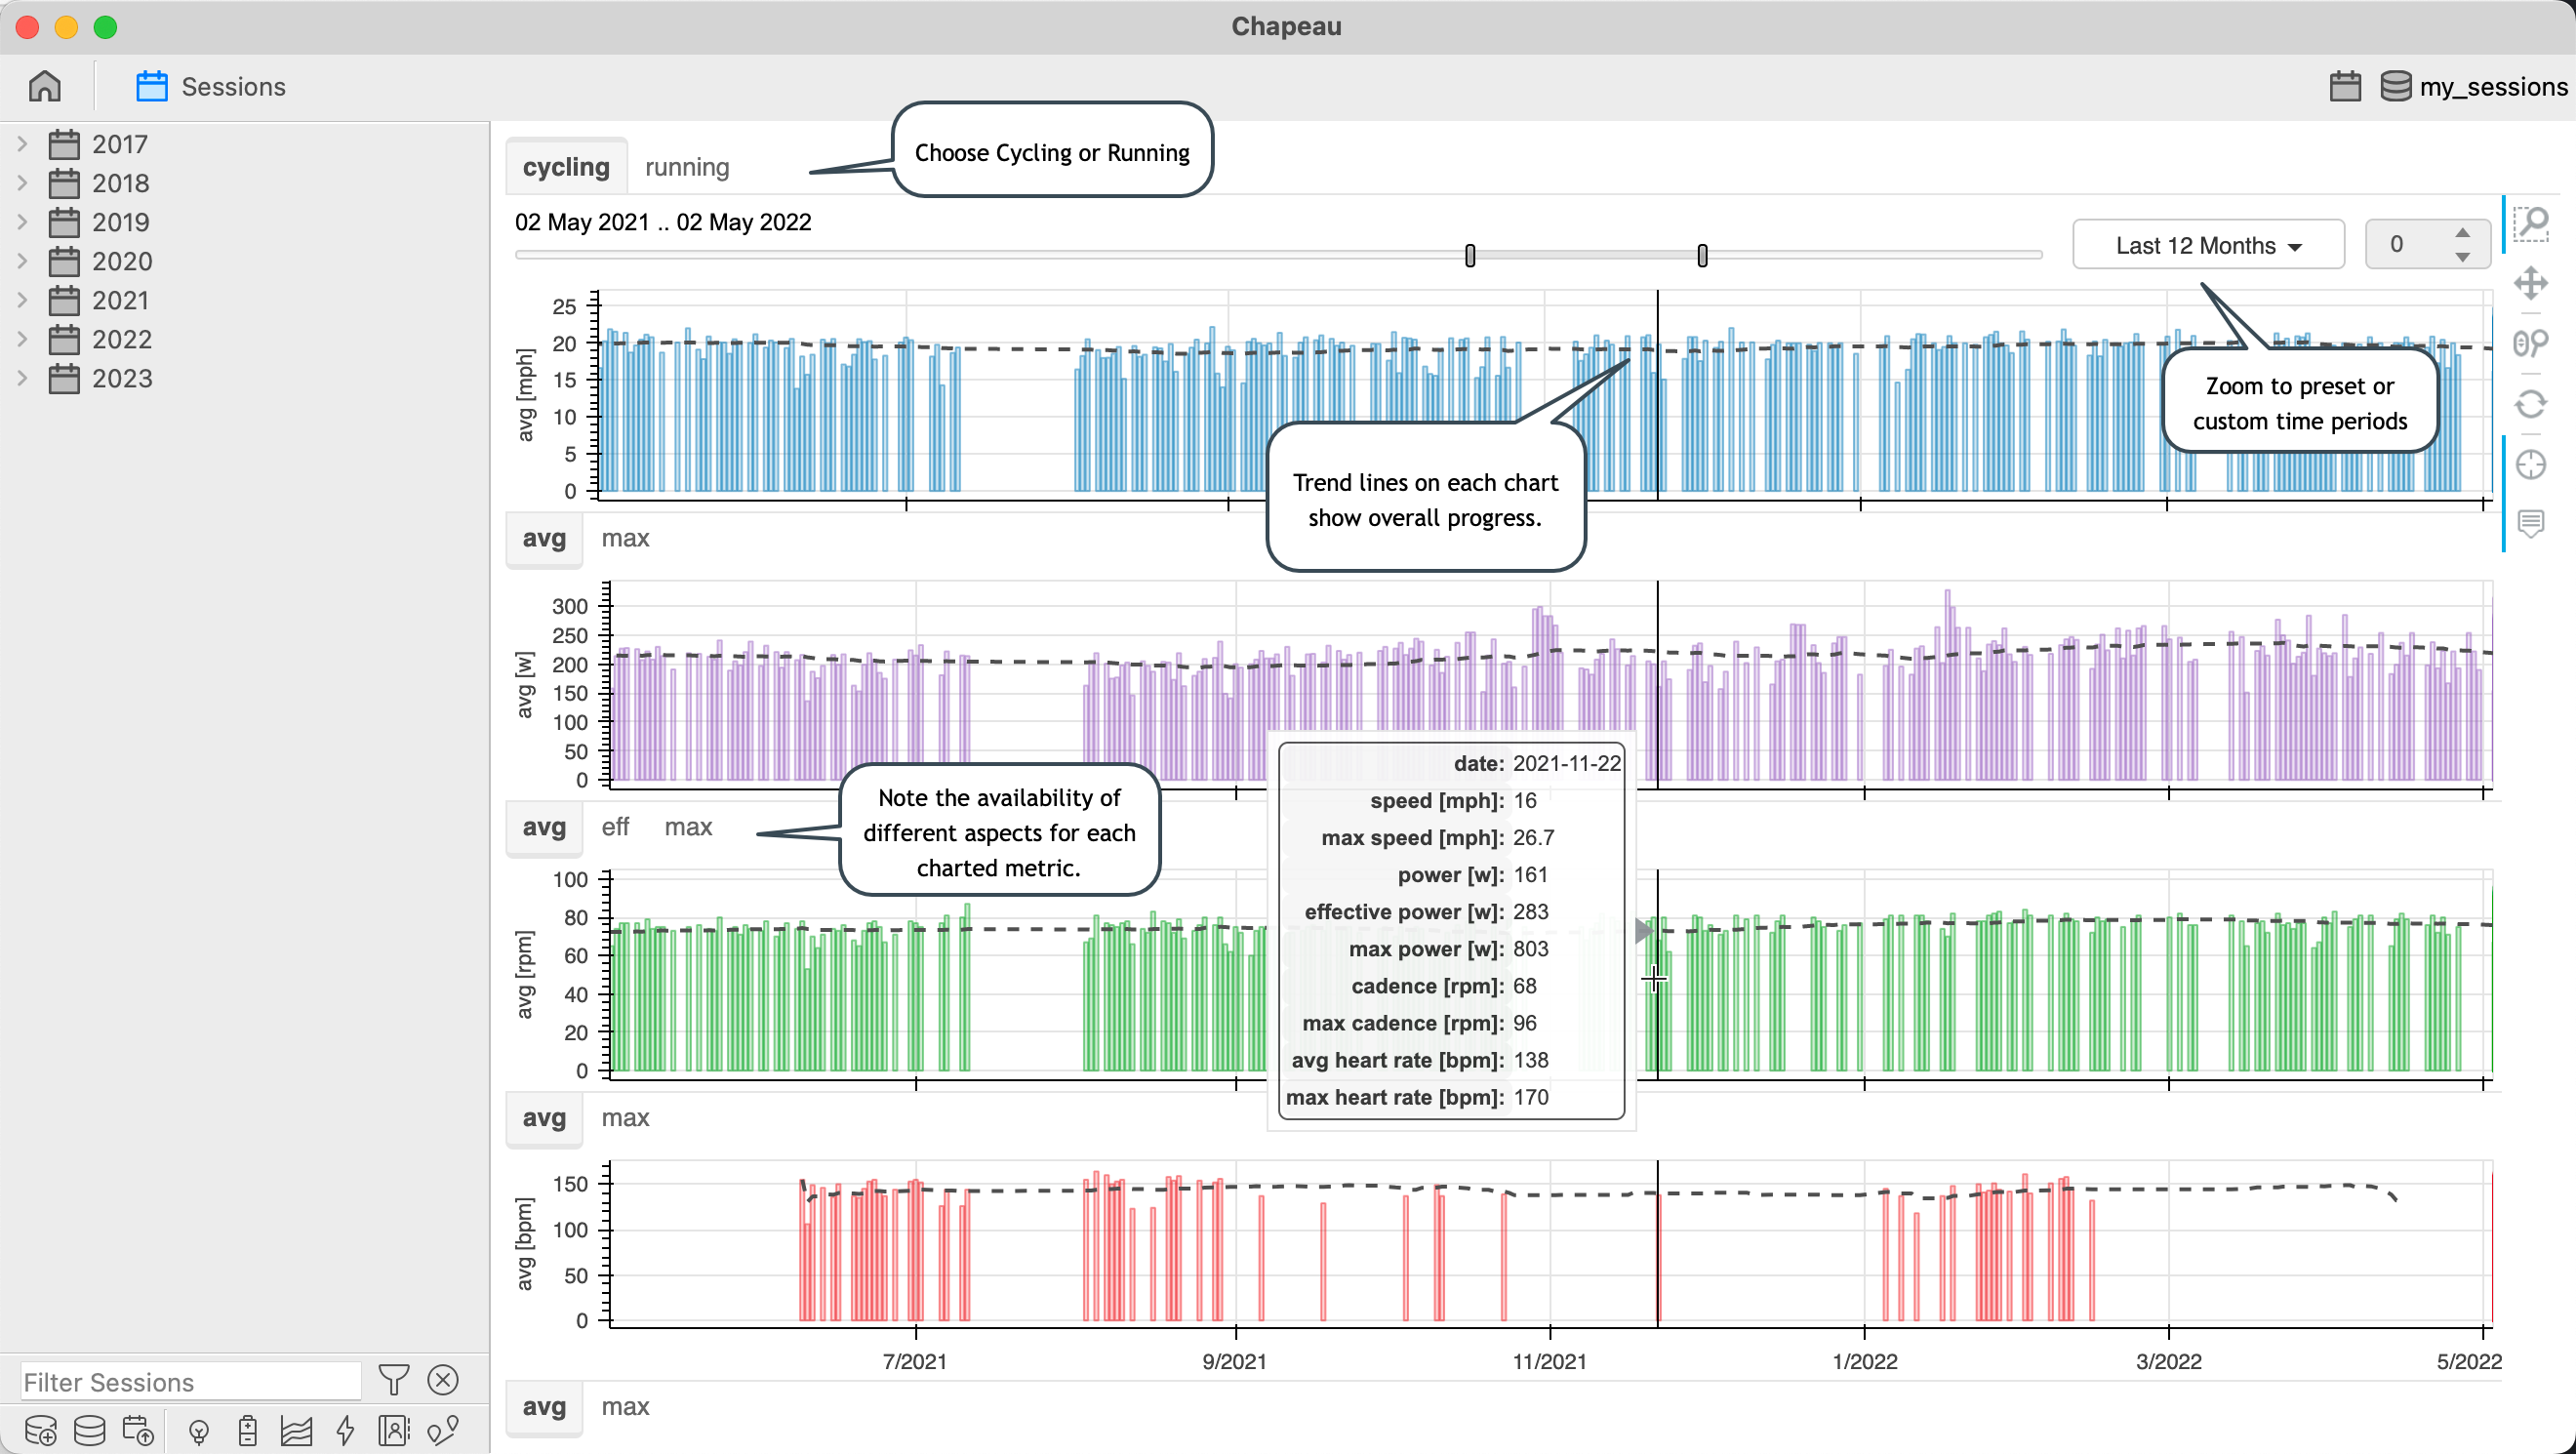
Note
The information from these charts is what is used on the Session Summary panel to generate the trend indicators.
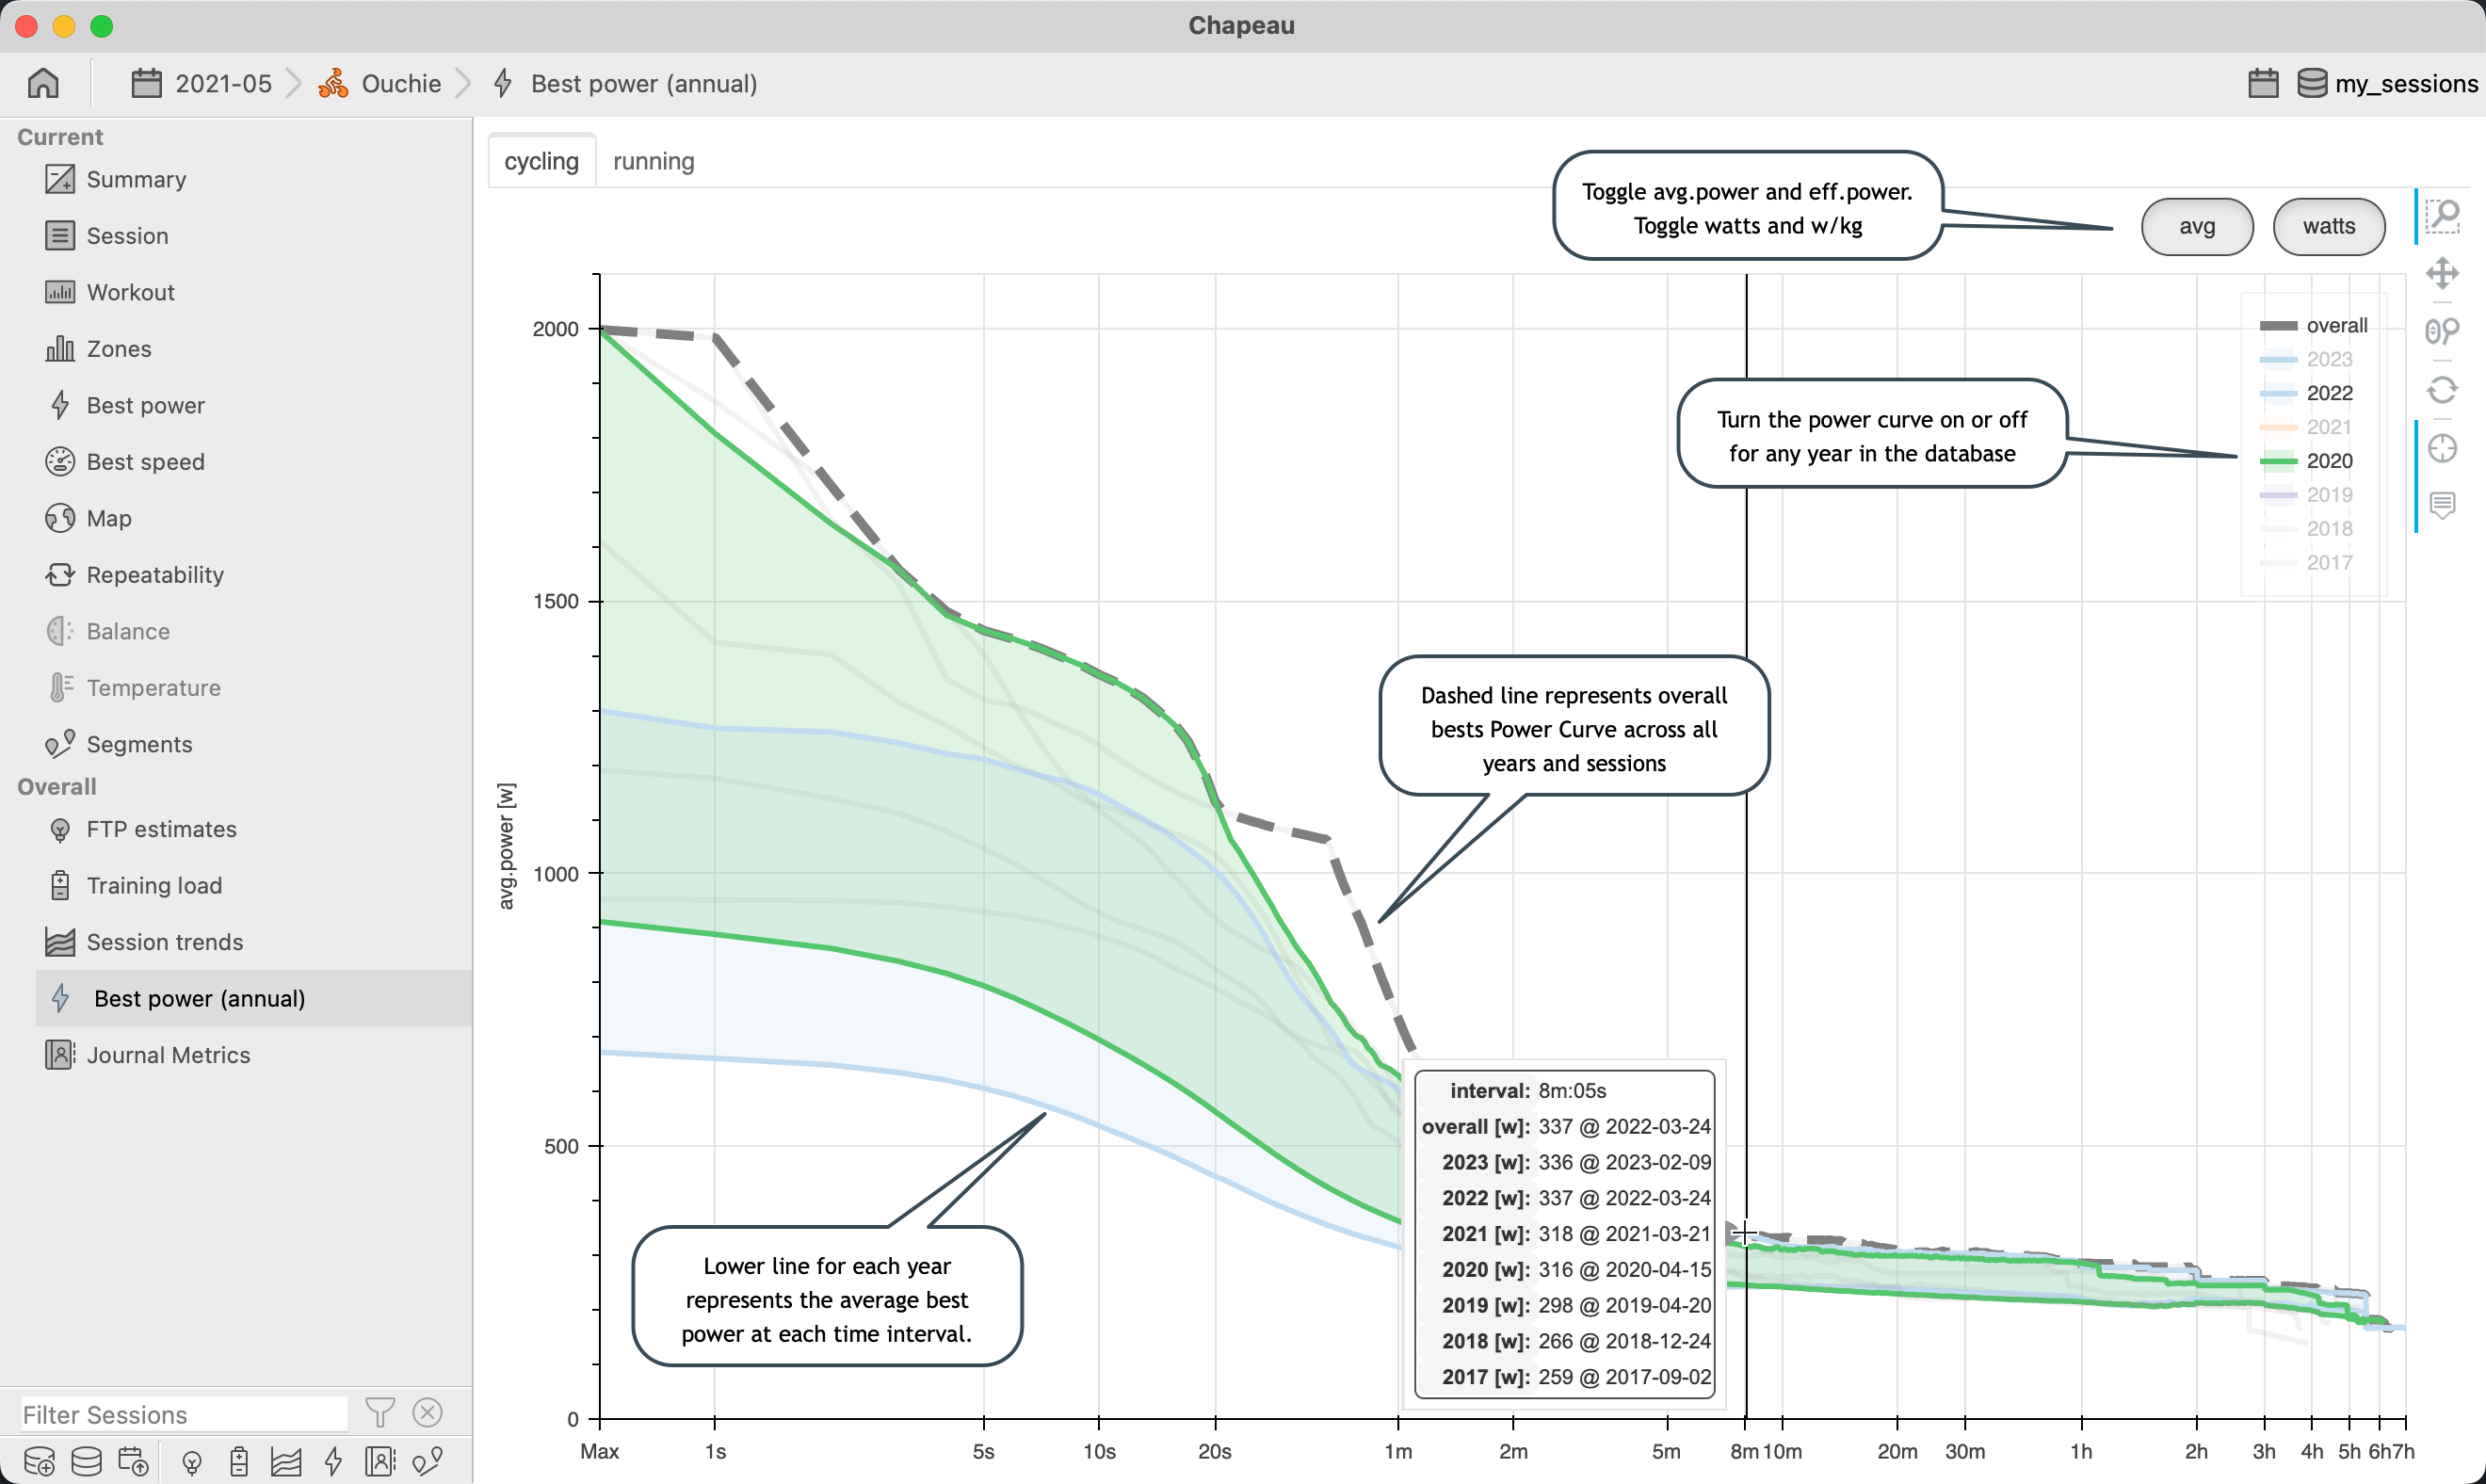
Best Power (annual)
Important
NEW in 2.6 added support for running sessions
The Best Power (annual) chart displays a power curve for each year in the athlete’s database. Use it to display power progress from year to year at different intervals.
Journal Metrics
Important
NEW in 2.5 shows trends for most of the Athlete Journal Metrics. NEW in 2.6 added support for running metrics.
The Athlete Journal Metrics chart shows values entered into the Athlete Journal vs dates. The chart may show the following data if present in the database:
Weight
Max Heart Rate
Blood Pressure
Note
FTP, Illness and Injury, and Menstrual Cycle are shown on FTP Estimates and Training Load charts.